
Appearance
The graph and its rules live as text next to your code. The portal turns that text into a picture: one command opens a read-only map of your architecture in the browser — every component, every rule, and whether each one is actually verified against the code as it stands right now.
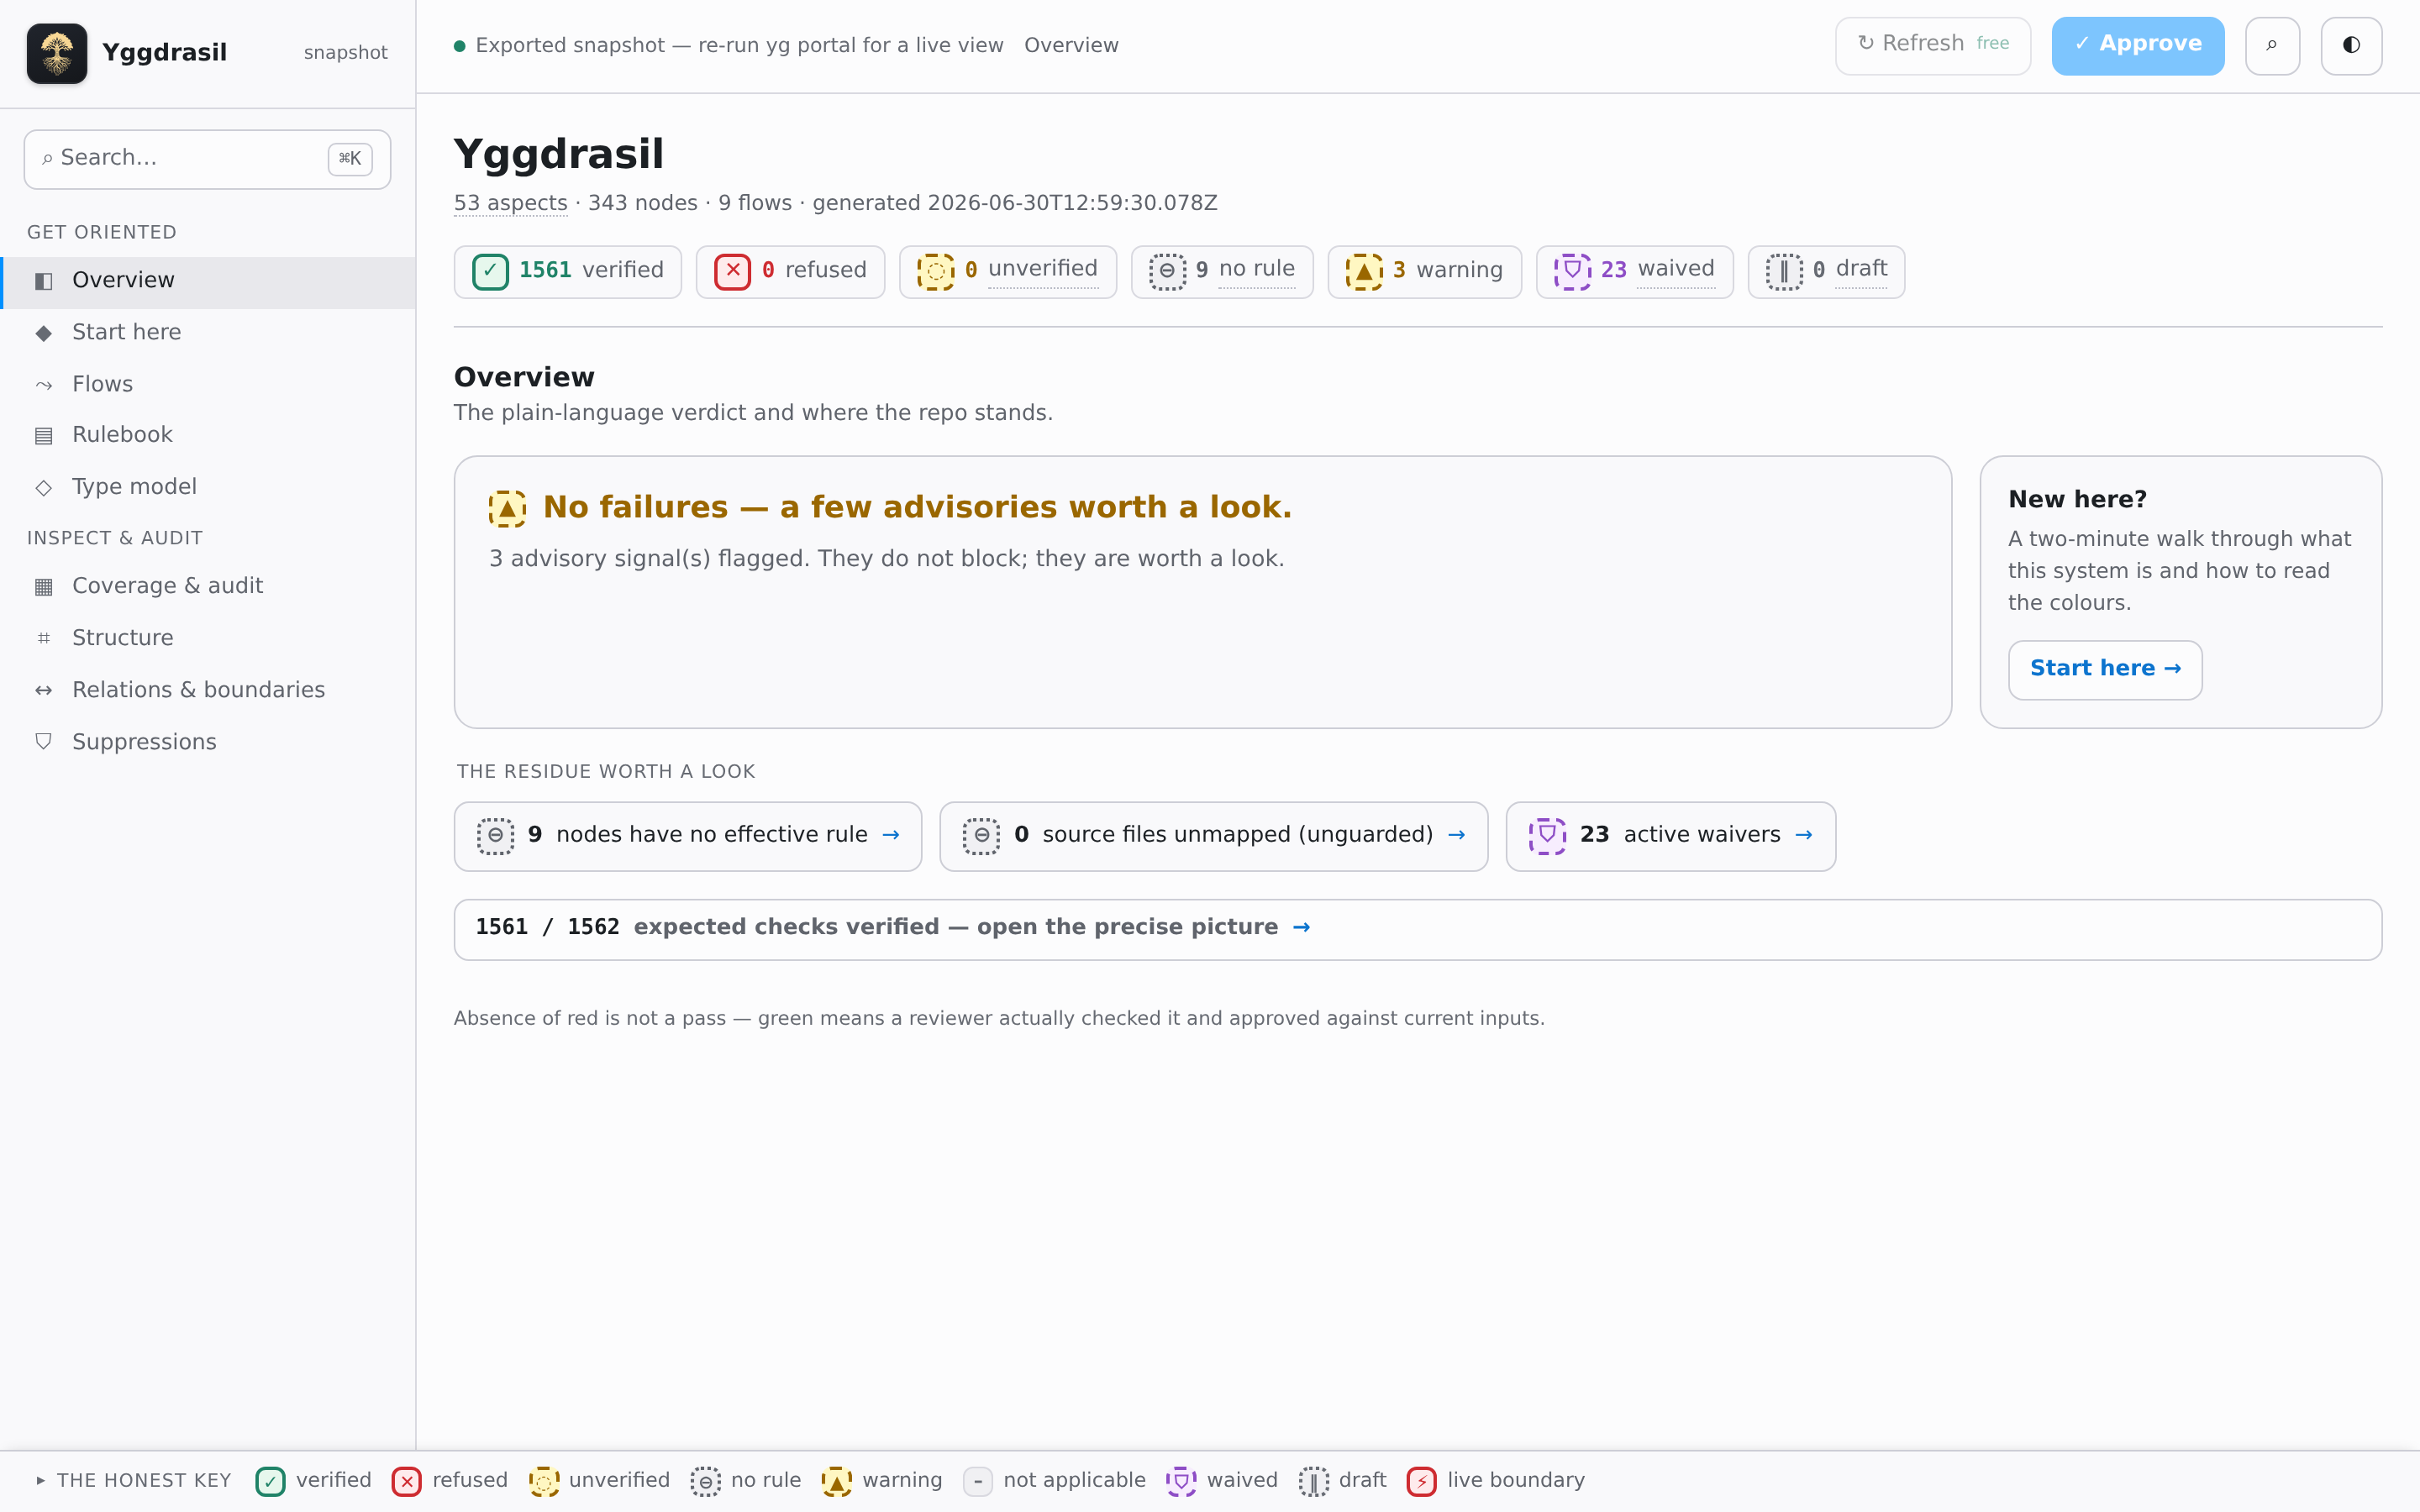
It is built for a glance and for a drill-down. The overview gives you a plain-language verdict — "no failures, a few advisories worth a look" — and the counts behind it. From there you can open any component to see why it passed (or what it still needs) — rule by rule, each one marked with its enforcement level (blocking the build, advisory only, or still in draft and not yet enforced) — or open any rule to read its actual text and every place it lands.
Open it
bash
yg portalThis serves the portal on a local address that only your own machine can reach, and prints the link. It is read-only in the sense that matters: browsing it never touches your source, your graph, or the lock file. The one action that can act on the project is a single, clearly-labelled approve — and even that just runs the same verification you would run from the command line; you can turn it off entirely with yg portal --no-write for a shared screen or a wall display. The page's other controls write nothing at all: a ↻ Refresh button that re-fetches the live data for free, a ⌕ button opening a ⌘K-style command palette over views, components and rules, a ◐ light/dark toggle, and the in-page export bars described below. (Like yg check, the portal does quietly maintain its own gitignored classification cache under .yggdrasil/ as you browse, when coverage.type_level is on — never your lock, your graph, or your source.)
For anything that could act on the project — the approve action, the cost preview, and the live data behind them — the portal answers only requests that come from its own page, so another website you happen to have open in a different browser tab cannot reach across and trigger the approve action, even though the portal lives on your own machine. (The page shell and its assets are served to anything on your machine, but they do nothing on their own.)
To hand the picture to someone who does not have the project checked out:
bash
yg portal --staticThis writes one self-contained file — no server, no internet, no build step — that opens in any browser and shows the exact same map, frozen at the moment you exported it. Add --open to either form to launch your browser straight at it.
By default the served form uses a fixed local port (4317) — pass yg portal --port <n> to choose another — and the static form writes to yg-portal.html in the project root — pass yg portal --static --out <path> to write it elsewhere.
What you see
A row of views down the side, each answering a different question:
Overview — where the repo stands, in one sentence, counting what actually stops the build apart from what is only a heads-up, plus the residue worth a look: components with no rule yet, source files not mapped to anything, and any active waivers. With
coverage.type_levelon, a file satisfied by the type-level lattice is never counted in "not mapped to anything" — a file whose matched type actually has a rule that applies to it gets its own "satisfied" line instead, so a checked file is never called unguarded. "Satisfied" here means accounted for, not that a verdict has already been reached: the file's own real verdict — verified, refused, or still unverified — sits in the bar on Coverage & audit, not on this line. A type-covered file whose matched type carries no rule at all reads differently again, on its own line, using the same "no rule" treatment as the rest of the unguarded surface — so a file that merely matches a type, with nothing actually checking it, is never shown as satisfied either. A third, rarer case gets its own line too: a file whose matched type's rules an aspectimpliescycle stopped from ever being resolved is reported as unknown, not as "no rule applies" — the cascade never ran, so the honest answer is that what checks this file could not be worked out, never that nothing does.Coverage & audit — the full ledger. Every expected check, every verdict, with a single honest bar: the only green is a check a reviewer actually ran and approved against the current code. Every non-empty band on that bar stays visible, however small its slice, so a handful of refusals is never too thin to see. Free local checks and reviewer-judged checks are shown apart, and a needs-attention worklist gathers what still needs fixing: findings that stop the build are grouped separately from advisory ones, and each finding names the real components and files it actually touches. When the fix is the same for everyone it names, it is shown once; when it differs from one subject to the next, each subject gets its own fix instead of borrowing one that does not apply to it. A finding with no component or file of its own — one that names the whole project rather than a part of it — carries its full explanation in place of a subject list. Gaps in coverage (files nothing was ever asked to check) get their own block, separate from the rule findings. The command line caps this list to keep a terminal readable; the portal page does not — it shows every group in full.
With
coverage.type_levelon, every type-covered file is listed by name with the type that covers it. One with a rule that actually reaches it carries its own real verdict right there — verified, refused, an advisory warning, or not-yet-verified, each shown with the reviewer's reason wherever it has one — the same verdict already folded into the bar above; naming the file just makes it possible to see which one it is. One matched by a type with nothing that applies sits under its own "checked by nothing" line instead, with no verdict to show, because nothing ever checked it. And one whose type's rules an aspectimpliescycle blocked sits under its own "could not be worked out" line, naming the cycle. Each of these three listings longer than twelve entries is capped, with the remainder summarized as a count. Separately, and regardless of whethercoverage.type_levelis on, a file under acoverage.excludedroot is listed by name too, in its own, uncapped "deliberately excluded from coverage, never enforced" block.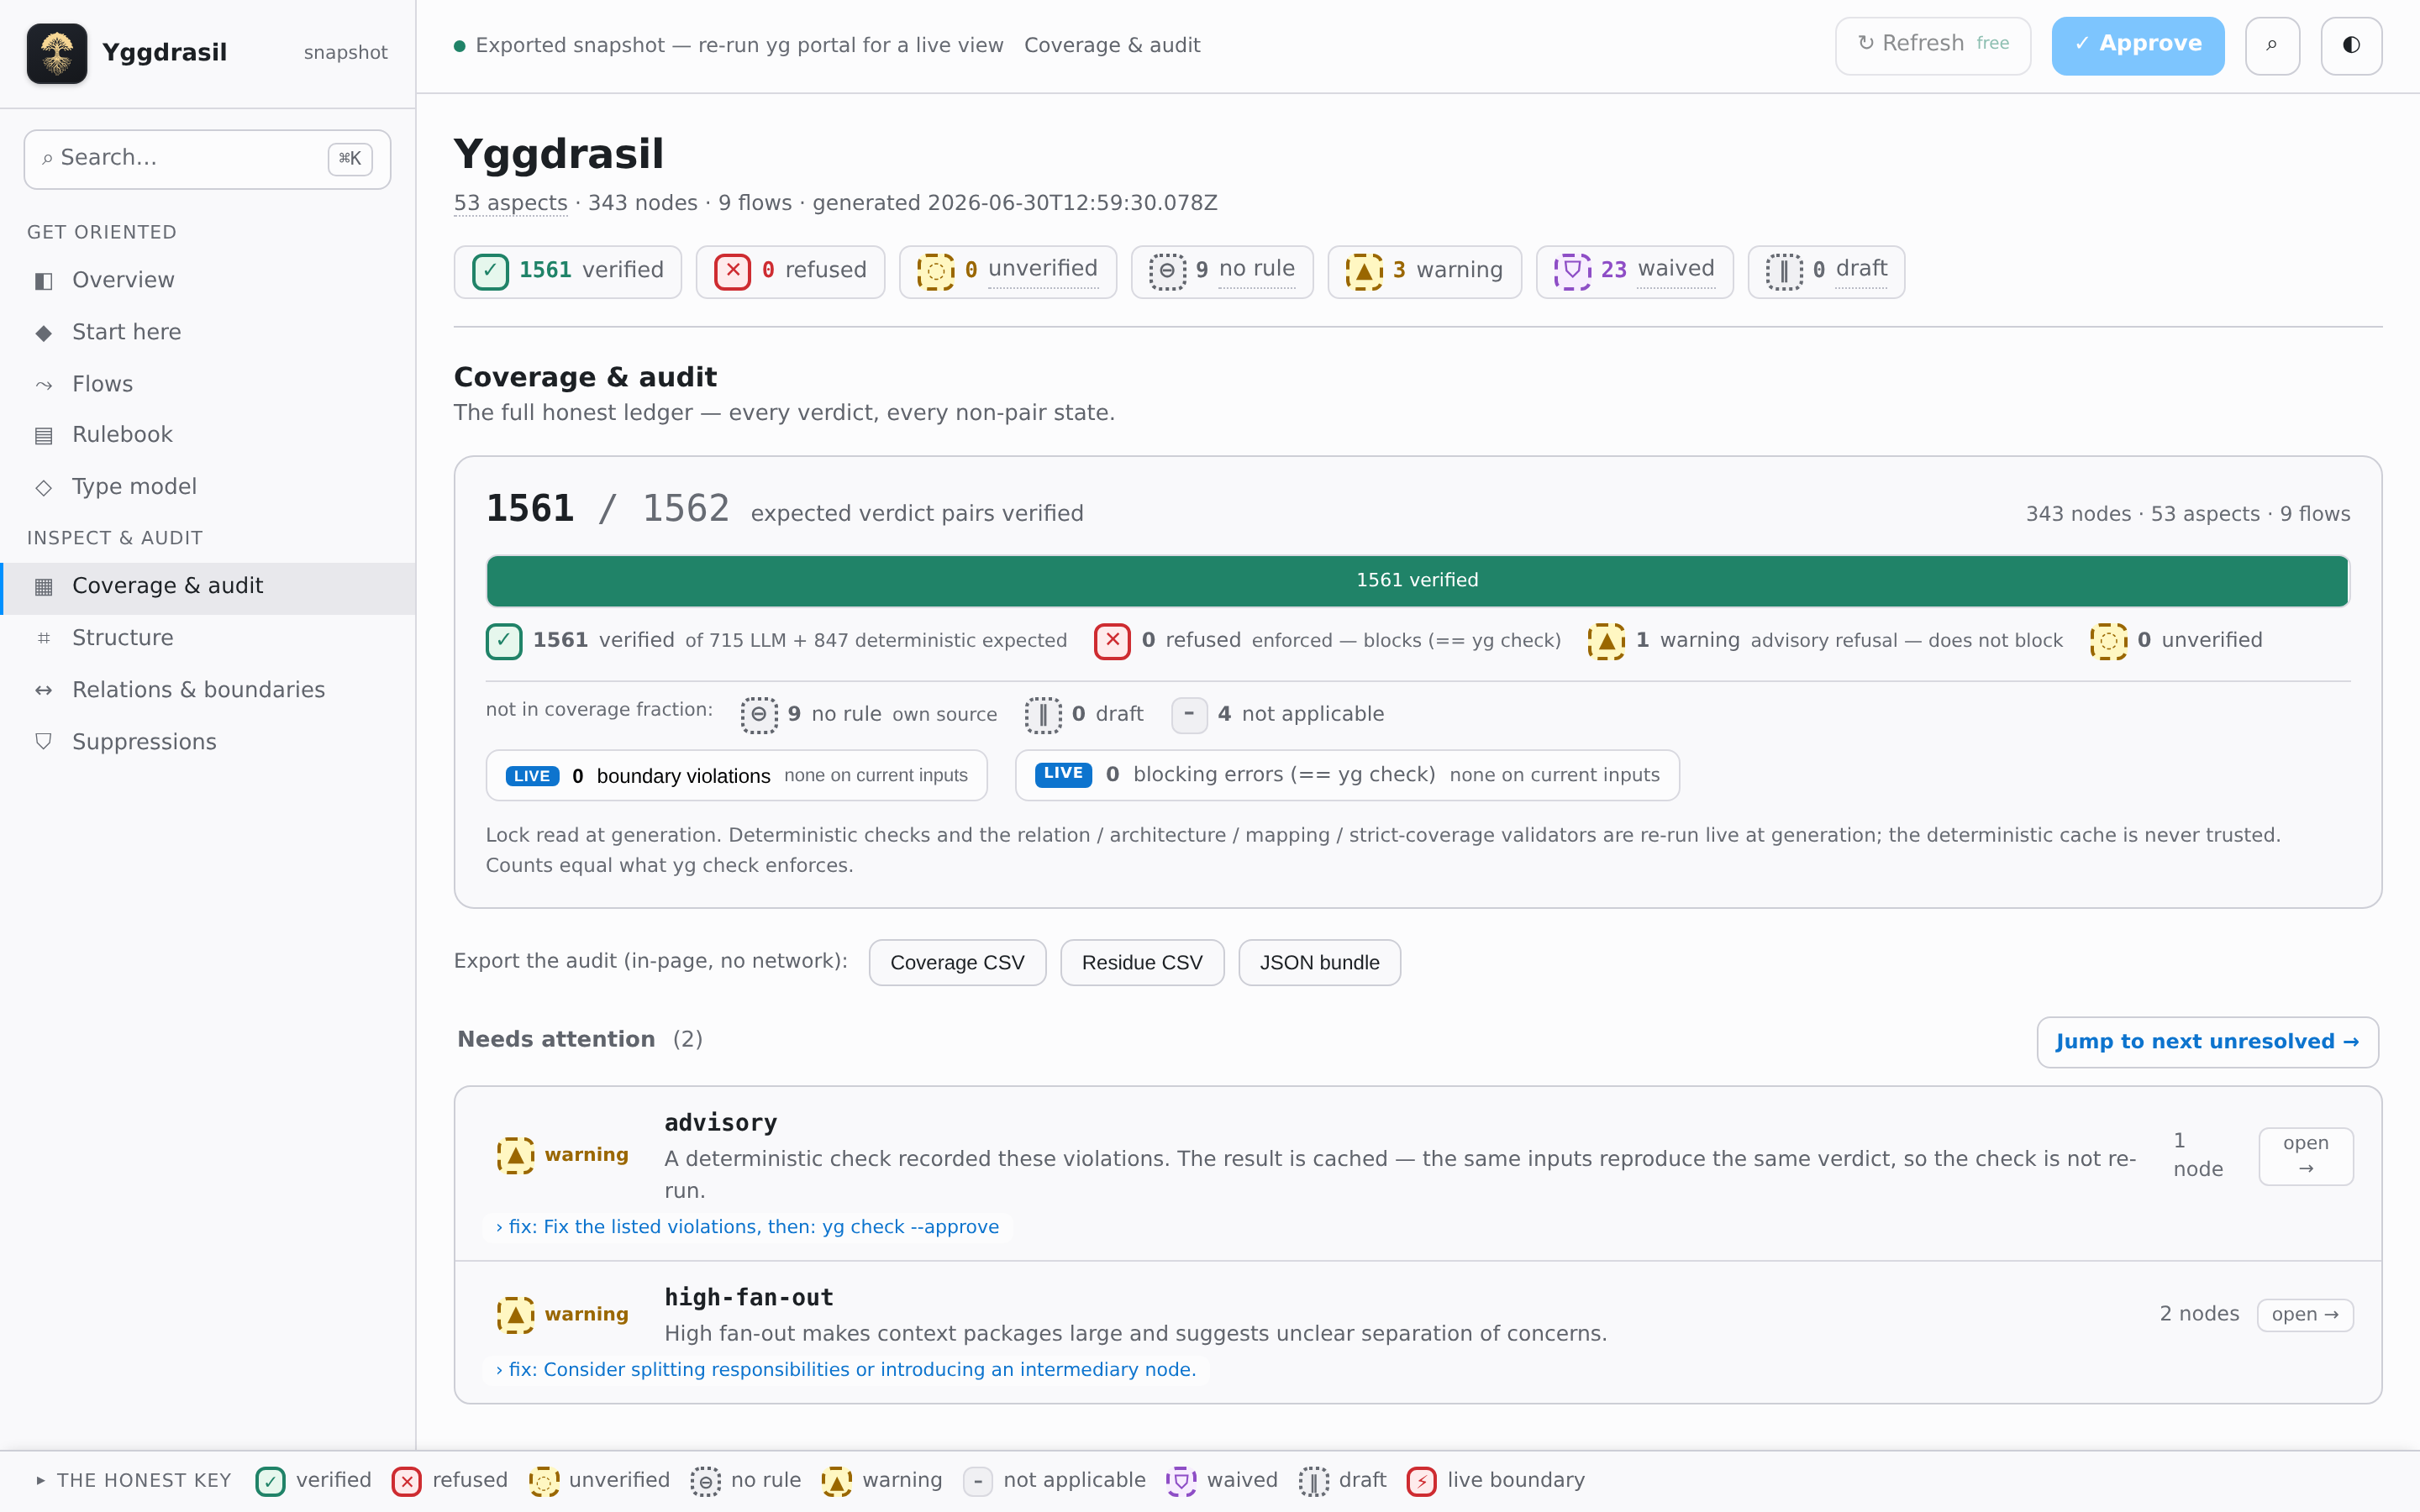
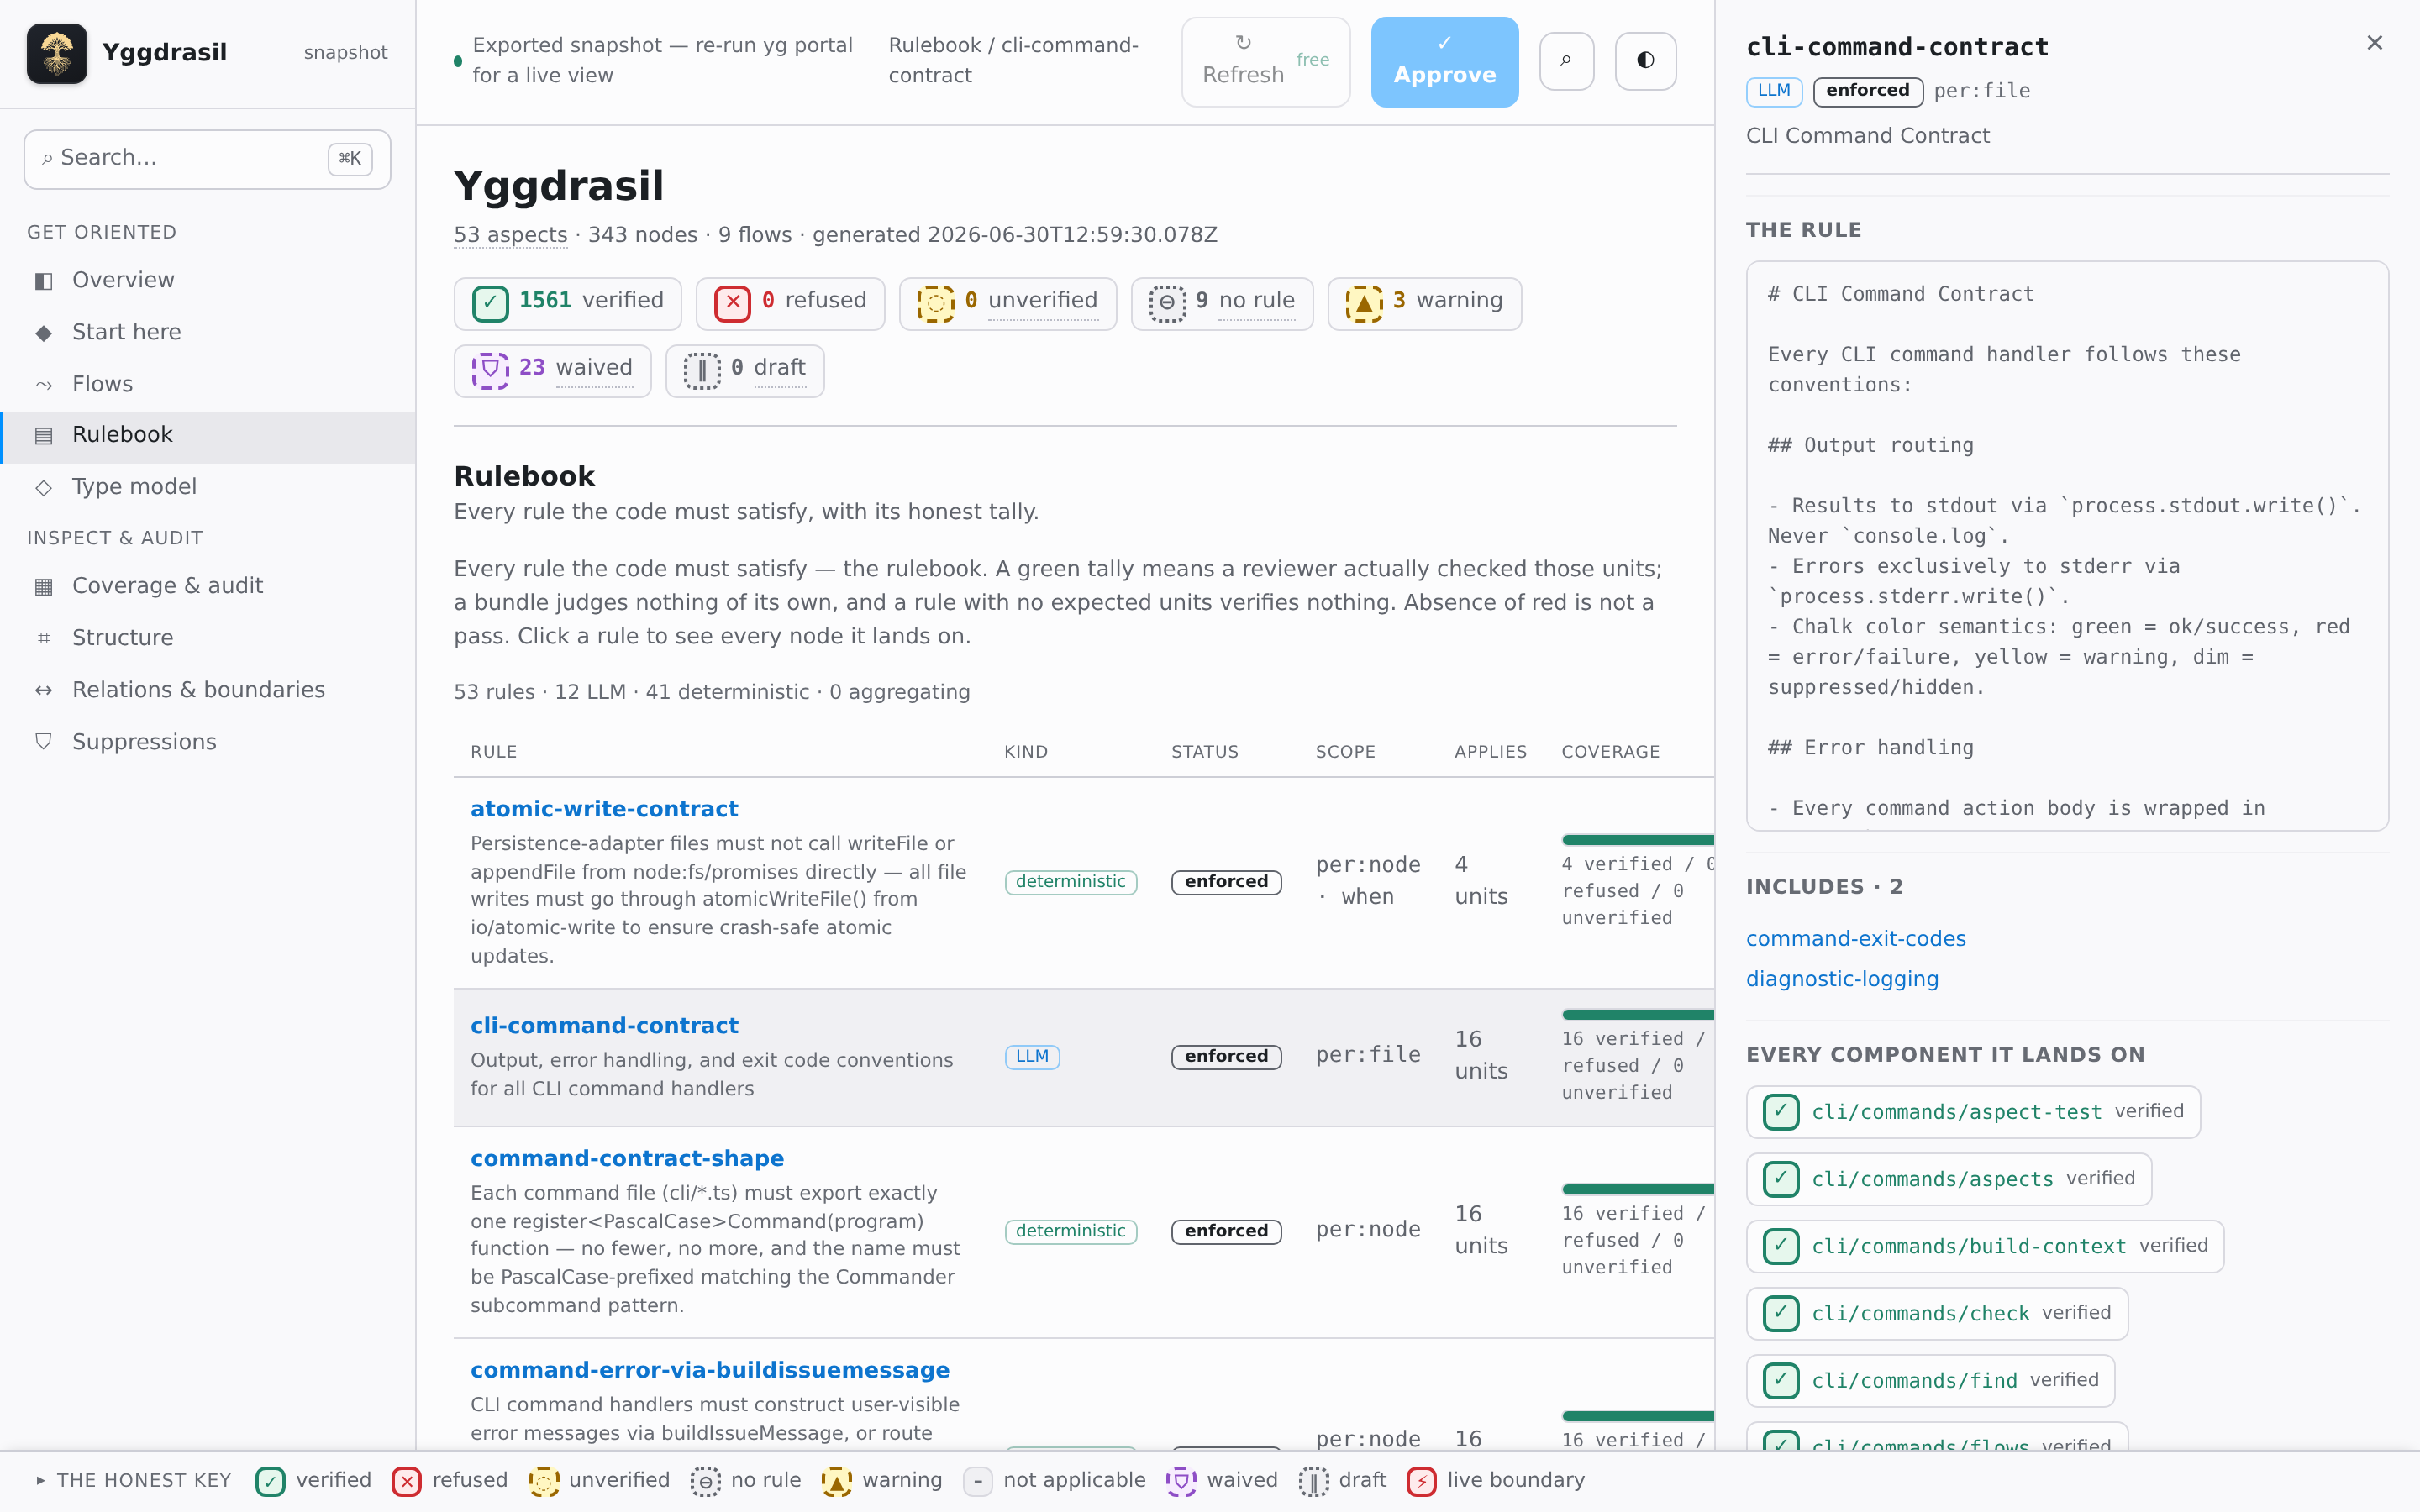
Rulebook — every rule the code must satisfy. Select one and the panel shows what it actually demands: the rule's own text (the prose you wrote, or, for a rule enforced by a local script, that script's source), what kind it is, where it applies, and every component it lands on with that component's honest verdict — each clickable straight through to that component.
Type model — the vocabulary your architecture is written in: every kind of component, the rules each kind carries by default, and which components are of that kind.
Relations & boundaries — what each component is allowed to depend on, what it actually depends on, and where the two disagree. A kind with no declared restriction reads as free to depend on any other kind, not as forbidden from depending on everything; an empty entry, by contrast, really does mean nothing is permitted there. If the allow-list itself could not be read for a kind, that shows as a gap in the data — never as a ban that was never actually declared.
Dependency structure — the shape of how components depend on one another, in plain language: the dependencies that reach farthest across the tree, how the component groups at each level depend on one another (and where those dependencies form a loop), and how far a change tends to travel from an average component. It is honest about its own limits — if the dependency scan cannot run it says the structure is unknown rather than showing an empty graph, and on a small project it shows the raw reach figure without over-reading it. Event relations are left out of this picture and the view says so. With
coverage.type_levelon this is the same widened pictureyg structureprints on the command line — every import touching a type-covered file joins it too, and the reach line says "component or type-covered file" once one does.Flows — your business processes, each participant marked with its honest state, so a single weak link in a flow is never hidden behind an otherwise-green picture.
Suppressions — every deliberate waiver, sorted riskiest first, with the reason and a flag on the risky ones: a wildcard that silences every rule on its line, an aspect id that names no known rule (likely a typo or a rename that outlived the field it renamed), an aspect that is still draft (the reviewer never runs there, so the waiver is a no-op), a rule that by design can never raise a false alarm (so the waiver is not actually silencing anything that could have fired), or a range that runs unbounded — because a waived check is not a pass. A clean waiver names its real reach — a single line, a range, or the whole file — instead of calling every waiver "bounded" alike, and when the suppression markers found on disk outnumber the waivers actually listed, the page says so too: a range's closing marker is not itself a waiver, so the two totals can genuinely differ.
Structure and Start here — the component tree with a filter, and a short guided walk for someone seeing the project for the first time.
Two of those views also hand you something to take away. Coverage & audit carries an export bar — "Coverage CSV", "Residue CSV", "JSON bundle" — and Suppressions its own "Export CSV" / "Export JSON". Both build the file inside the page, with no network call and nothing written to the project, so the audit travels to someone who has no checkout of their own.
Honest by design
The portal never rounds up. A state is shown with colour and a glyph and a word, so it reads the same to everyone, and the distinct states are kept distinct: verified, refused, not-yet-verified, advisory warning, waived, no-rule-yet. The absence of red is not a pass — green means a reviewer checked that code and approved it against the inputs it has now. The numbers on every view are the same numbers yg check reports; the portal is a window onto that result, never a second opinion.